 It’s hard to beat the power of visuals when it comes to getting your message across in an engaging way. Studies have shown that internet readers pay closer attention to images carrying information than to plain text only.
Infographics can transform a boring step-by-step guide into something more engaging and easier to understand. Beyond helping to educate, Infographics make an excellent addition to the content marketing toolbox of any tech business.
Do you think infographics are too complicated to do yourself? Not so! Many new online tools make it simple to create stunning infographics that you can use to strengthen your content marketing strategy and to help brand your business.
Getting Started with Infographics
Infographics predate the internet itself. The combination of text, statistics, and images to relay information has been used for things such as explaining the economy of England in the 1700’s and promotional signs at the 1972 Munich Olympics.
Today’s infographics take multiple forms, combining text, visuals, and information in a variety of ways to give us information that’s easily digested and in a way that is perfect for today’s shorter attention spans.
The use of infographics is about more than just data visualization, they’re often used as lead magnets, educational aids, and as sharable content meant to take your company’s name and URL along with it wherever it ends up.
Infographics have been shown to increase website traffic by up to 12%. (HubSpot)
So, how can you work infographics into your content marketing strategy? What are some of the benefits you’ll see from investing your time and effort?
We’ll start with some tips on how to create infographics, then discuss where you can use them in your IT business marketing strategy.
How to Make Infographics
You don’t have to be a graphics pro or even know how to use Adobe Photoshop to make infographics. There are multiple tools online that offer a drag-and-drop style interface and let you edit pre-set templates to make attractive infographic visuals.
First let talk about some of the elements you’ll need to consider when creating an infographic:
- Type of Information: Is it a step-by-step? Office 365 benefit statistics? The type of information being displayed will dictate the best format to use.
- Audience: If you’re writing to a residential audience, you may want to use friendly icons and fun images (like a happy computer). If it’s a commercial audience, you’ll want the infographic to look more business-like.
- Colors/Fonts: These will go along with the audience type, but also consider colors that reflect your brand. While they don’t have to match exactly, you don’t want your infographic colors to clash with your own logo either.
- Branding: Make sure there is room in a corner of your infographic to display your IT business logo and website URL. You want your infographic to be shared, so you should have your company displayed on the graphic itself.
There are several online tools you can use to make infographics from pre-built templates or from scratch. Many of them are free, and some offer a free trial or secondary paid “premium” tier for more features.
Here are some of the top sites that offer the ability to design infographics pretty easily (no design experience required!):
- Venngage (Free option, Premium is $19/month)
- Canva (Free option, Pro is $9.95/month)
- Piktochart (Free option, Pro is $24.17/month)
- Adobe Spark (Free option, Individual plan is $9.99/month)
- Infogram (Free option, Pro is $19/month)
Ideas for Types of Infographics to Make
Once you’ve decided to give infographics a try to bolster your IT business marketing, your next decision is what to make. Here are several ideas to help with infographic content targeted to IT customers.
Educational Content
Visuals have been found to improve learning and retention by 400%, which make them an excellent way to relay educational content, which is one of the most popular types of content searched online.
People use the internet to learn just about everything, and the “How-To” topic has steadily remained in the 90th percentile of search interest (measuring level of popularity of a search term between 1 and 100). According to Google Trends, the search term “How to make my computer faster” has a popularity that consistently ranks in the 85-90 range (out of 100).
By creating educational infographics, you can both add value to your website by offering “self-help” content, and you can draw more visitors looking for technology related how-tos.
Some ideas for educational infographics you could make for your IT business:
- How to install memory
- Steps for making a computer faster
- How to customize your Windows 10 Start panel
- How to create a business continuity plan
- Using Accessibility Settings on Windows/Mac
- Steps for checking if an email is real or fake
Comparison
A comparison infographic can help give people the information they need to make a choice between two or more things. These can be product or software focused, like a Microsoft Teams vs Slack comparison, or one that compares the costs of break/fix services versus having a managed IT services plan.
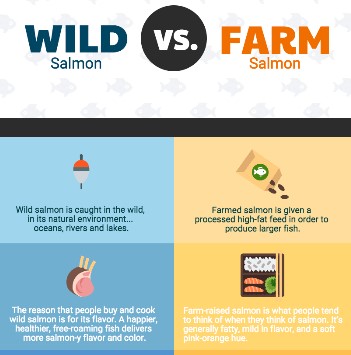
Comparison infographic example from Venngage.com
You can use a comparison to both educate and promote products and services. For example, if you’re a reseller for particular anti-malware software, do an infographic comparison with that product and a product with less features.
Statistical Infographic
People love to reference statistics to back up a specific point, so statistical infographics and very sharable can help you get backlinks to your website for SEO purposes while also putting your brand in front of more eyes.
Think of some statistics that your clients might be interested in, such as the latest cyberthreat data or the most popular mobile phones by market share.
One way to create a statistical infographic is to pull data points from a recent publicly available report, then cite the report source at the bottom of the infographic. Some you can try are:
- Cost of a Data Breach Report by IBM & Ponemon Institute
- State of Malware report by Malwarebytes Labs
- Email Cybersecurity report by Cisco
- Or do your own study via client surveys
Tips & Tricks
Tech tips are a great way to grab someone’s attention and position yourself as a trusted expert. An infographic format makes the perfect way to serve up bite-sized pieces of information. Tips will also have sticking power as a “go to” reference for doing something faster.
Some ideas for tips & tricks you can use for an infographic include:
- Google search tips
- Top keyboard shortcuts for Windows/Mac
- Windows 10 tricks for (insert a target market, like Accounting Firms)
- Tips for setting up social media security
Using Infographics to Your Advantage
Once you have your infographic completed, it’s time to deploy it to help generate more business. Here are some of the ways to use your infographics.
Social Media Content
The visual style of infographics make them perfect as sharable content on social media and can help your message and business name reach more people.
According to SearchEngine Journal, infographics are liked and shared over social media 3x more than any other form of content.
If you’re making an infographic for social sharing, keep in mind the image requirements for a particular platform. If you’re using one of the longer style infographics, then you may want to make a thumbnail image to post on social media with a link to your page with the full infographic.
Lead Magnet
Lead magnets help you build up your email marketing list by asking website visitors to exchange their email address for the chance to access your great content. All styles of infographics work well as lead magnets.

Email marketing has one of the best ROI’s of any type of marketing method, generating approximately $38 for every $1 spent. So, the more you can build up your email list the better chance you have at bringing in qualified leads and new business.
Email Newsletter
And speaking of that email newsletter, it’s a great place to introduce a new infographic and offer additional value to those that subscribe. Including an infographic with a product comparison can help you generate repeat business by introducing current clients to a new software or service offering you have.
Press Release
If you’ve put together a particularly informative infographic, then it could be worthy of a press release, which can get your business mentioned in local media, magazines, and other publications.
An example of a press release worthy infographic would be if you created an original report and infographic about technology challenges that’s based upon your own data collected by surveying over 100 businesses or fellow IT service providers.
Blogs
Website blogs are one of the main cogs in any content marketing and SEO strategy and infographics fit in perfectly with the blog format. Use your blog to discuss the items in the infographic in more detail (being sure to use plenty of related keywords). Your readers get the best of both worlds, an easy-to-read infographic version of the content and a more detailed text version.
Brochures/Presentations/eBooks/White Papers
Once your infographic has been introduced and is out there generating some traffic, a great way to repurpose it is to add it into pertinent sales brochures, presentations, eBooks, or industry white papers.
An infographic can help you break up long areas of text, add a pop of color and interest, and provide helpful back up information that fits in nicely with larger marketing pieces.
Expand Your Content Marketing with Style
The human brain can process entire images in as little as 13 milliseconds. So, why not take advantage of the power of infographics?! They can market your business in a whole new way and nicely compliment your longer-form content.
What’s your experience with infographics for marketing your IT business? Share your story in the comments!
Speak Your Mind