
For most tech businesses, their website is the main place they generate leads and new customers. So, knowing where people go when they’re browsing your site can help you improve poorly performing pages, find which calls to action work best, and identify where traffic is coming from.
Google Analytics is one of the best tools you can use to gain valuable insights into what’s happening on your site, but many find it overwhelming because of all the data you can find there. They aren’t sure which reports are going to help them the most.
If you’ve ever struggled with Google Analytics, we’ve got some reporting tips for the best ways to get the most out of it to optimize your website performance and understand how visitors are interacting with your content.
The Most Helpful Analytics Areas for Site Performance
Google Analytics is by far the market leader when it comes to traffic analysis tools for websites. It currently has 56.4% of the market share, with the closest competitor, Facebook Pixel, at 8.5%.
Once you get the code installed on your website, going into the interface for the first time can be a little intimidating – there are so many different report types – and it can bring to mind “too much of a good thing.” But knowing which reports to use first for the most valuable website information can reduce the complexity and help you familiarize yourself with the interface at the same time.
Following are some of the best ways you can use Analytics to help you gain actionable insights about the people visiting your tech business website every day.
1. Track Conversions
One of the most important things to know about your website is which conversion methods are working and which aren’t. For example, you may have two different pages with an offer for a free IT security check, but how do you know which signup form is converting better?
By setting up goals in Google Analytics you can track each of those pages separately by sending each signup form to a different thank you page that you’ll designate in the “goals” area of Analytics.
To get started:
Go to the administrative settings, and under the website view, select Goals. You can then set up a total of 20 different goals for various activities you’d like to track on your website. Some examples would be:
- Contact or signup forms
- Sales through your online shop
- Appointments scheduled
- Emailed referral links
- When someone plays a video on your site
- Newsletter signups
- Shares of social content
Once your goals are set up, they start recording conversions, which you can track in the conversions area. Not only can you see which conversion methods are getting the most hits, you can click into them to see thinks like, whether Google PPC or Google organic is bringing in more conversions or which keywords a PPC lead source used to find your site in the first place.
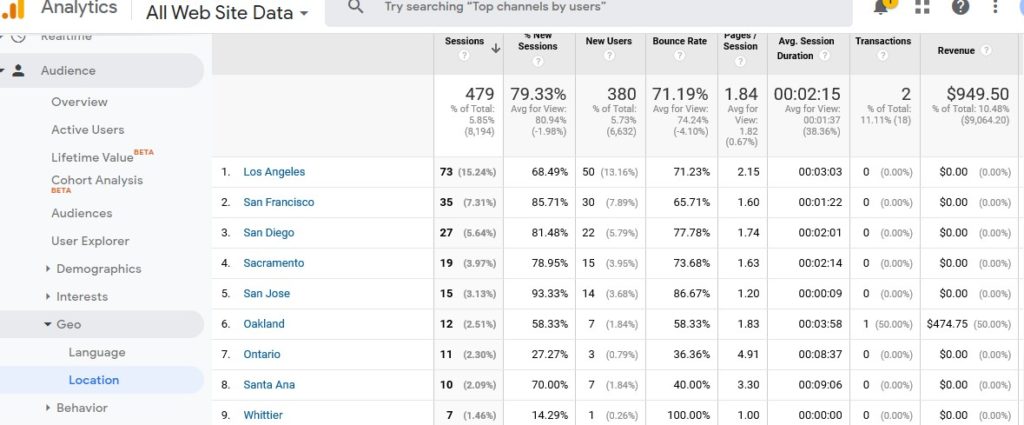
2. Geo Location of Visitors
Knowing which cities your site visitors are coming from can help you know where you need to focus your advertising. In Analytics you can look at multiple demographics of your audience, and one of the most helpful for marketing decisions is their geo location.
Choose Audience, and then Geo and Location. You can view by country, state, or city to get an overall view of where everyone that visits your site is located, and where you may want to add more marketing.
3. Identify Your Best and Worst Performing Pages
Which of your site pages are inviting interaction and which are losing people after a few seconds? Google Analytics gives you all the data to understand where you can improve your site content to reduce your bounce rate and drill down into top-performing content.
By viewing Avg. Time on Page, you can see if people are really reading your latest blog and which blogs garner the longest dwell time. If a page has a high percentage of exits, and it’s not a contact form or ‘thank you’ page, that could be a sign you need to work on it and write better content to keep visitors from leaving.
To see this area, go to Behavior > Site Content > All Pages. You can also look specifically at your landing pages to identify those that aren’t performing well.
4. See What People Are Searching on Your Website
Many IT business owners will put a search bar on their site to help users get to the information they want faster. But they don’t always know what their site visitors are searching for. Knowing that information can help you optimize to better serve those visitors.
For example, if you’re seeing that the number one search on your website is for cloud-based backup help, it can be a catalyst for potentially signing up as a reseller for a top backup application, if you’re not already. You might optimize by creating a dedicated product page for a cloud-based backup program as well as incorporating more blogs on the topic.
Track what people are searching on your site by going to your admin settings, then the website view. Click View Settings > Site Search Settings.
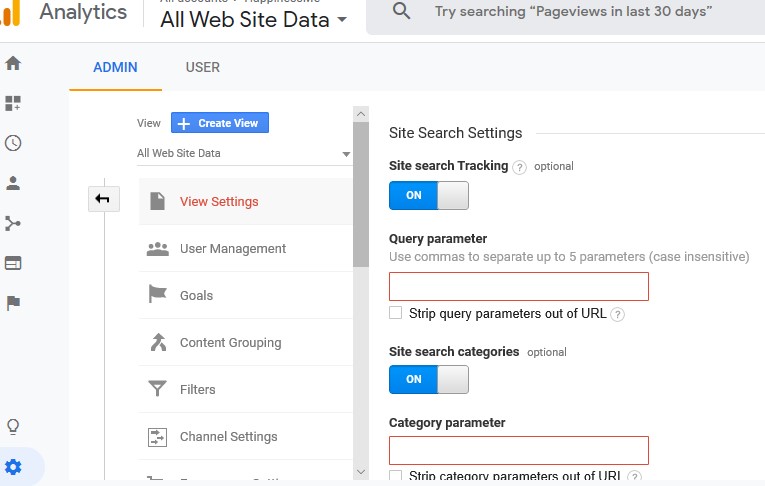
Once it’s tuned on, you can enter in the Query Parameter field, the word or words that designate internal query parameters, such as term,search,query,keywords. This article provides a full step-by-step.
5. Use Custom Dashboards & Reports
A common complaint of many a busy tech business owner is, “I don’t have enough time to look over a bunch of reports every day!” Using the dashboard in Google Analytics, you can set up custom reports and dashboard graphs that show you the most important things you want to know at a glance.
Just go to the Customization area and you can choose to add a dashboard that you customize yourself, use the starter template, or choose from a whole gallery of dashboards that other Analytics users have created.
All the gallery dashboards are rated by users so you can easily find the most useful. Analytics dashboards that are currently showing in the top 5 are:
- Occam’s Razor Awesomeness
- New Google Analytics User Starter Bundle
- Content Analysis Dashboard
- SEO Dashboard – Finding Top Content and Keywords
- Social Media Dashboard
Reporting is also customizable and it’s easy to save a report in multiple areas of Analytics based upon the view of variables you’ve set. What’s especially handy is that you can set any reports you find particularly helpful to automatically run and email to you on a timeframe you set. So, you save time not having to pull up the program every day and just get the key information you need sent to your inbox.
6. Set up Analytics Alerts
Have you ever had your website go down in the middle of a busy day and had no idea until a customer later tells you they had trouble accessing it. Using alerts in Google Analytics can help you keep an eye on things and immediately know if something is amiss or if there is a particular event that happens that you want to know about.
Set up Alerts in the administrative settings, under the website view, look for Custom Alerts. You can receive alerts by email or text message. They can be set up for any number of different website triggers. Here are a few examples of how you can use them.
Get alerted when:
- Traffic slows or drops off entirely
- You’ve made an ecommerce sale on your site
- One of your conversion goals triggers
- Site traffic falls off or increases for a particular city
7. Find Slow Loading Pages
Does it seem like you’re losing people when they get to certain site pages? It could be because your page loading time is causing them to leave. Many visitors are browsing from a mobile device these days, which exasperates the load time issue.
People just aren’t going to stick around if your site pages take too long to see. Pages loading within 2 seconds have an average bounce rate of 9%, but if a page takes 5 seconds to load, bounce rate increases to 38%.
You can use the Site Speed area, under Behavior, to get an overview of your page load times and see individually how each page compares to your site’s average page load time.
Analytics also offers Page Speed Suggestions to help you optimize and reduce load time.
8. Optimize for the Natural Flow of Your Visitors
Does a visitor go to your main page first, then your managed services page, about us page, and then drop off before visiting Contact Us? Knowing that can help you optimize for the visitor’s flow pattern for your sales funnel by doing things like adding a contact form to your other pages or beefing up your about us page if it’s got a high percentage of exits.
Under the Audience area of Analytics, you’ll find Users Flow at the bottom. This is an incredibly useful chart that lets you see exactly which page paths your visitors take, and which pages cause them to want to explore more.
You can look at the flow pattern for your entire site, PPC leads, organic leads, or any number of other different filter settings to really get to know your audience and how they interact with your website.
Gain Powerful Insights to Help Your Business
Once you get into Google Analytics, you realize that it has many powerful reporting insights that other companies try to charge for. If you focus on the most helpful areas of Analytics first, you can get what you need without getting overwhelmed and then dive in a little deeper as you have time.
Do you have a favorite report or insight from Google Analytics? Share it in the comments!
Thanks for Breaking this down it’s useful to see different areas to focus on. I’m always looking for ways to better engage with Google Analytics.
Glad it was helpful Greg!
Nice article! This looks “doable” and encourages me to give it a try! (Something I’ve been putting off for a while)
Good! Let us know how it works out for you.